BlogGuide
Financial close KPIs: The 8 month-end close metrics to track, with formulas and a free scorecard
18 min read
Key takeaways
- Track eight month-end close KPIs: days to close, on-time task rate, reconciliation completion, aged reconciling items, late journal entries, post-close adjustments, close hours, and cost per close.
- APQC's published benchmark, republished on a page dated October 13, 2026, puts monthly consolidated statements at 5, 6, and 10 calendar days for top, median, and bottom performers (N=10,201), counted from the first trial balance run.
- One close can be 6 business days, 9 calendar days, and 6 days on APQC's clock at the same time, so state your unit and start point before you compare.
Financial close KPIs, also called month-end close KPIs, are the few metrics that show how fast, accurate, and costly your close is each month. Tracking them gives you a baseline you can defend, catches errors before the statements go out, and keeps speed targets honest. This guide covers the eight KPIs with formulas, days-to-close counting, APQC and Ledge benchmarks, leading indicators, cost per close, targets, ERP tracking, and a free scorecard.
What are financial close KPIs?
Financial close KPIs measure how well the close itself runs: how fast it is, how accurate its numbers are, and what it costs.
- KPI vs metricA metric is anything you can count, such as journal entries posted. A KPI is one of the few metrics you set a target for and review every month.
- Financial close KPIs vs month-end close KPIsThe same set. "Financial close" also covers quarter-end and year-end, which get the same KPIs with their own targets.
- Close cycle timeAnother name for days to close. A "close cycle KPI" and "financial close cycle time" mean the same measure.
Close KPIs differ from business KPIs such as DSO, gross margin, or EBITDA, which describe the company's results. Close KPIs describe the work your accounting team does to produce those results each period, as set out in the guide to the month-end close.
Which month-end close KPIs should a controller track?
Track eight: days to close, on-time task rate, reconciliation completion, aged reconciling items, late journal entries, post-close adjustments, close hours, and cost per close. If you can track only three, pick days to close, post-close adjustments, and reconciliation completion, because together they show speed and quality.
Example company (illustrative): Every formula on this page uses one company, a 300-person SaaS business with $90 million in revenue, two entities, and NetSuite. Its October 2026 close ended Saturday, October 31, and the controller signed off Monday, November 9.
| KPI | Formula | October 2026 result (example) |
|---|---|---|
| Days to close | Business days from the day after period end through sign-off | 6 business days |
| On-time task rate | Close tasks completed by their due date ÷ close tasks due | 112 ÷ 120 = 93.3% |
| Reconciliation completion | Reconciliations reviewed and approved by the BD4 deadline ÷ reconciliations required | 46 ÷ 50 = 92.0% |
| Aged reconciling items | Count and dollar value of reconciling items open more than 30 days | 7 items, $18,600 |
| Late journal entries | Manual journal entries posted after their cutoff ÷ manual journal entries | 9 ÷ 140 = 6.4% |
| Post-close adjustments | Entries dated in the closed period and created after sign-off, as a count and as absolute dollars ÷ materiality threshold | 4 entries; $38,000 ÷ $250,000 = 15.2% |
| Close hours | Hours spent on close work, inside and outside the close window | 260 hours |
| Cost per close | Close hours × loaded hourly cost, plus close software and outside help | $17,275 |
On-time task rate, reconciliation completion, aged items, and late entries are leading KPIs you can read during the close. Days to close, post-close adjustments, close hours, and cost per close are lagging: they show what the close produced and cost.
Days to close is the right headline, but it measures speed alone. The example company's six-day close looks strong until you see four post-close adjustments, which means part of October's work landed in November. Close cycle time is elapsed days, while close efficiency is hours and dollars per close, so you need both. The guide to the zero-day close covers why days to close alone can mislead and how to measure close effort in hours.
Fast close metrics are the speed KPIs in this table: days to close and on-time task rate. The leading checks covered below keep a short close on schedule.
How do you calculate days to close?
Days to close is the number of business days from period end through the day the controller signs off the close, the definition this page uses. Day 0 is the last calendar day of the month, and business day 1 (BD1) is the first working day after it.
Formula: Days to close = NETWORKDAYS(period end + 1, sign-off date, holidays). Calendar days to close = sign-off date − period end.
- StartDay 0 is the last calendar day of the month, even when it falls on a weekend. Don't count Day 0 itself.
- EndPick one event and write it down. Controller sign-off with the period locked works well because both leave a timestamp in your ERP. "Statements issued" and "board pack sent" are later events.
- UnitBusiness days skip weekends and the holidays your company observes. Calendar days count every day.
Example
The October 2026 close starts after Day 0, Saturday, October 31. BD1 is Monday, November 2, and sign-off on Monday, November 9 is BD6. NETWORKDAYS(November 1, November 9) returns 6 business days, and November 9 minus October 31 is 9 calendar days.
The weekday a month ends on changes the calendar count, even when the business-day count stays the same. With no holidays in the window:
| Month ends on | 5-business-day close signs off | 6-business-day close signs off |
|---|---|---|
| Monday | Monday7 calendar days | Tuesday8 calendar days |
| Tuesday | Tuesday7 calendar days | Wednesday8 calendar days |
| Wednesday | Wednesday7 calendar days | Thursday8 calendar days |
| Thursday | Thursday7 calendar days | Friday8 calendar days |
| Friday | Friday7 calendar days | Monday10 calendar days |
| Saturday | Friday6 calendar days | Monday9 calendar days |
| Sunday | Friday5 calendar days | Monday8 calendar days |
A holiday inside the window adds at least one calendar day for the same business-day count, and three if it pushes sign-off past a weekend. That's why business days give you a steadier trend line, and calendar days matter mainly when you compare with APQC.
How do you compare your close with APQC and other benchmarks?
APQC's published benchmark, republished on a page dated October 13, 2026, puts monthly consolidated statements at 5 calendar days for top performers, 6 at the median, and 10 at the bottom (N=10,201). The page date is not the data date, so treat these as APQC's latest published figures, not new 2026 measurements. APQC's live measure, checked November 8, 2026, also shows a 6-day median, with its quartiles open only to members. Its clock runs in calendar days, weekends included, from running the initial business-entity trial balance to completing the agreed consolidated statements.
That start point comes after your Day 0. If your first trial balance runs on BD2, APQC's clock skips the first days of your close. Its 6-day median and your 6-business-day close are different measures.
Many AI answers still quote 4.8 days for the top 25% and 6.4 days at the median. Those figures come from a "Metric of the Month" article in CFO, published March 5, 2018. It drew on about 2,300 organizations in APQC's survey at the time. Use APQC's current published figures instead.
Ledge's 2025 survey of 100 finance professionals (published April 10, 2025, updated August 8, 2026) counts business days. Half of its respondents take more than five business days to close. Because Ledge counts business days and APQC counts calendar days from a later start, keep them in separate comparisons.
| Measure | Unit | Starts | Ends | Example company, October 2026 |
|---|---|---|---|---|
| Your days to close | Business days | Day after period end | Controller sign-off | 6 |
| Your days to close, calendar | Calendar days | Day after period end | Controller sign-off | 9 |
| APQC monthly consolidated statements (page dated October 13, 2026) | Calendar days, weekends included | Initial business-entity trial balance run | Consolidated statements completed | 6 (trial balance Tuesday, November 3, to November 9) |
| Ledge 2025 survey | Business days | Not stated in the survey | Not stated in the survey | 6, in the 6–7 day group |
By APQC's clock, the example company sits at the median. By its own count from period end, it takes 9 calendar days, which is why you match the start and end events before you compare.
APQC also publishes separate measures for period-end management reports and shared-services closes. Its 25th and 75th percentiles and peer-group cuts require an APQC benchmark license. For close-time figures by company size, see How long should month-end close take.
How do you measure close quality, not just speed?
Measure close quality with four KPIs: post-close adjustments, reconciliations approved by the deadline, reconciling items older than 30 days, and first-pass approval rate.
Post-close adjustments are entries dated in a closed period but created after sign-off. Count them, and total their absolute dollar value without netting debits against credits, since a $20,000 overstatement and a $20,000 understatement don't cancel each other's risk. Use manual journal entries as the denominator for a rate, because high-volume automated entries inflate the total and hide changes. The guide to adjusting entries covers how these entries are booked.
There is no published standard for how many post-close adjustments are normal. Compare each month with your own baseline, and send any single adjustment above a set share of materiality to the controller. Materiality is a review trigger, not a bright line. A smaller adjustment can still matter if it changes a trend, affects a covenant, or points to a control gap. Judge each late entry by the period it belongs to and when it should have been recognized: an item that arose after period end belongs in the open month, not in the post-close count.
Example
The example company's four October adjustments total $38,000, or 15.2% of its $250,000 materiality threshold for review. Tagging each one by cause shows where the problem started:
| Post-close adjustment | Cause | Amount |
|---|---|---|
| Contractor invoice accrual | Late input from a department | $12,000 |
| Deferred revenue reclass | Reconciliation not approved by BD3 | $15,500 |
| Prepaid amortization correction | Reconciliation not approved by BD3 | $6,200 |
| Payroll tax accrual true-up | Estimate trued up to actual | $4,300 |
| Total | $38,000 |
Two of the four, $21,700 or 57% of the total, came from reconciliations that missed the BD3 approval gate. That root-cause tag tells you what to fix next month.
Reconciliation completion, sometimes called reconciliation success rate, counts a reconciliation only when it's reviewed and approved, not when it's prepared. The example company approved 46 of 50 by BD4, or 92.0%. Many teams set a 100% target for high-risk accounts, because an unreviewed high-risk reconciliation is a control gap. Decide in your policy how often lower-risk accounts are reviewed. The guide to account reconciliation covers how to rank accounts by risk.
Aged reconciling items show whether differences get resolved or rolled forward. Group open items by age, 0–30, 31–60, 61–90, and over 90 days, and report both count and dollars. The example company had 7 items over 30 days, worth $18,600.
First-pass approval rate is the share of reconciliations and journal entries a reviewer approves without sending back. A falling rate, or tasks reopened after review, is the clearest sign of too much rework.
Manual journal entries have no universal "too many" number. Sort them into recurring, calculated, transaction-driven, and judgmental entries, then track how many of the recurring and calculated ones are still keyed by hand, since those are the first to automate. The guide to month-end journal entries covers each type.
Audit readiness shows up in two places. Audit adjustments are the lagging test of close quality, and reconciliations approved with support attached by the deadline are the leading one. If you're testing AI on the close, Does AI make the month-end close more accurate? covers the metrics that show whether it's working.
Which close KPIs are leading and which are lagging?
Lagging KPIs, like days to close and post-close adjustments, tell you how the last close went. Leading KPIs, like reconciliations approved by BD3 and journal entries in by cutoff, tell you during the close whether you'll hit this month's deadline.
Pair each lagging outcome with the leading checks that predict it, and give each check a day gate. The gates below are illustrative internal targets, not standards:
| Leading KPI | Day gate (example target) | Lagging KPI it predicts |
|---|---|---|
| AP, AR, and payroll subledgers closed | 100% by BD2 | Days to close |
| High-risk reconciliations reviewed and approved | 90% by BD3 | Post-close adjustments |
| Manual journal entries submitted by cutoff | 95% by BD3, 5 PM | Days to close, post-close adjustments |
| Close tasks on schedule | 90% at BD3 | Days to close |
| Open blockers | None older than one business day | Days to close |
| Reconciling items over 30 days | Lower than last month | Post-close adjustments, audit adjustments |
Example
On Wednesday, November 4, which was BD3, the example company had approved 15 of its 20 high-risk reconciliations, or 75% against a 90% gate. The close still signed off on BD6, but two of the four post-close adjustments came from those unreviewed accounts. The leading KPI flagged on Wednesday what the lagging KPI confirmed the following week.
Read leading KPIs every morning of the close. A short stand-up covers tasks due today, blocked tasks, reviews waiting, and the predicted sign-off day. Then move work out of the window where you can. Reviews of prepaids, recurring accruals, deferred expenses, and suspense accounts can often be finished before month end. Track the share of reconciliations finished before BD1 as one more leading KPI, with a target set from your own baseline.
How do you measure the cost of the close?
Cost per close is your team's close hours multiplied by each person's loaded hourly cost, plus close software and outside help for the month.
Formula: Loaded hourly cost = annual salary × load factor ÷ annual paid hours. Cost per close = Σ (close hours × loaded hourly cost) + close software + outside help.
Example
The example company uses a 1.25 load factor for benefits and payroll taxes and 2,080 paid hours a year (40 hours × 52 weeks), both illustrative assumptions:
| Role and salary | Loaded hourly cost | October close hours | Labor cost |
|---|---|---|---|
| Staff accountants (3)$75,000 each | $45 | 150 | $6,750 |
| Senior accountant$100,000 | $60 | 50 | $3,000 |
| Accounting manager$125,000 | $75 | 35 | $2,625 |
| Controller$160,000 | $96 | 25 | $2,400 |
| Total labor | 260 | $14,775 |
Add $1,500 for the month's share of close software and $1,000 for outside help, and October's cost per close is $17,275. That works out to $66.44 per close hour, or $207,300 a year if every close cost the same. Quarter-end months cost more: June's 340-hour close cost $21,821 at the same rates.
Count hours outside the close window too, such as pre-close work and reconciliations finished after sign-off, or the cost looks lower than it is. To find where the money goes, tag hours by task group, such as reconciliations, accruals, or review. Then automate the most expensive manual work first. Before you compare with a cost benchmark stated as a share of revenue, check whether it covers the whole finance function.
How do you set a baseline and targets?
Baseline each KPI on the median of your last three to six closes, then set a target one step better while holding post-close adjustments flat.
- Fix the definitions firstWrite down the start event, end event, unit, and what counts as complete before you pull any history
- Pull three to six closesUse ERP timestamps, not memory, for sign-off dates, task completion, and entry creation
- Use the medianOne bad month moves the average more than it moves the median
- Flag unusual monthsNote quarter-end, year-end, audit, and system changes, and track quarter-end closes against their own target
- Set a target one step betterMove one business day at a time, such as 8 to 7
- Hold quality flatA faster close with more post-close adjustments is not an improvement
- Change one process at a timeReview targets each quarter so you can see what worked
APQC's benchmark page makes the same point: ask your team how much time it realistically needs, and what causes delays, before you set a shorter target.
Example
The example company's last six closes, May to October 2026, took 8, 11, 7, 8, 9, and 6 business days. The median is 8, while the average is 8.2 because June's 11-day quarter-end close pulls it up. The controller sets a 7-day target for monthly closes and keeps post-close adjustments at 2 or fewer.
Targets are internal choices you agree with your CFO, not standards. Company type changes which KPIs you start with more than it changes the formulas:
| Company type | Start with | Add |
|---|---|---|
| Small business on QuickBooks Online with an outside CPA | Days to close, reconciliation completion, post-close adjustments | Changes made after the closing date |
| Mid-sized company with one or two entities | The eight KPIs above | Intercompany balances matched by BD3 |
| SaaS company | The eight KPIs above | Deferred revenue roll-forward variance between billing and the general ledger |
| Multi-entity or public company | The eight KPIs plus control KPIs | Days to report, audit adjustments, periods reopened |
Which KPIs go to the controller, the CFO, and the audit committee?
The controller needs leading KPIs daily during the close, the CFO needs a monthly page on speed, quality, and cost, and the audit committee needs quarterly control KPIs.
| Audience | Cadence | KPIs | Format |
|---|---|---|---|
| Staff accountants and accounts managers | Daily during the close | Their own tasks on time, their reconciliations approved by each gate, their late entries | Task list |
| Controller | Daily during the close, then a monthly review | All leading KPIs, open blockers, predicted sign-off day | Close dashboard |
| CFO | Monthly, after sign-off | Days to close, post-close adjustments in dollars, reconciliation completion, cost per close, trend against target | One-page scorecard with commentary |
| Audit committee | Quarterly | Reconciliations past due, items over 90 days, post-close adjustments above threshold, manual journal entry share, open audit findings, periods reopened | Short control report |
A month-end close KPI dashboard is the controller's version: leading KPIs at the top, today's blockers next, and the predicted sign-off day. The guide to the month-end close covers the wider close dashboard. A controller is judged on the outcomes the CFO sees: accurate statements, on a predictable day, at a known cost.
Review leading KPIs daily during the close and lagging KPIs once a month. Hold a 15-minute review after each sign-off on what ran late and why, and reset targets each quarter.
How do you track close KPIs in NetSuite, QuickBooks, or Excel?
You can pull most close KPIs from three timestamps your ERP or close tracker already stores: the period lock date, each entry's created date, and task and reconciliation completion dates.
- NetSuiteThe Period Close Checklist, under Setup › Accounting › Manage GL › Manage Accounting Periods, shows each period's tasks, who changed each one in the Modified By column, and a change history in System Notes. If Intelligent Close Manager is enabled, the Close Manager Tasks list (Lists › Accounting › Close Manager Tasks) holds Assigned To, Due Date, Status, and Date Completed for each task, and NetSuite fills Date Completed when the status is set to Completed. Users can change that date afterward, so for on-time task rate compare Due Date with the System Notes timestamp of the change to Completed, or restrict and review edits to Date Completed. For late tasks, filter that list for tasks not Completed with a Due Date before today. A transaction saved search filtered on Date Created finds journal entries dated in a closed period but created after sign-off (Oracle NetSuite Help, accessed November 8, 2026).
- QuickBooks OnlineSet the closing date on sign-off day under Settings › Account and settings › Advanced › Accounting, and record that date for days to close. The Exceptions to Closing Date report, found by searching Standard reports, shows changes made after you close your books (Intuit, "Edit your closed books," updated August 5, 2026). Not every line is a post-close adjustment, since it can include edits to existing transactions as well as new entries. Review and classify each change, using the audit log for detail, and count only posting entries dated in the closed period and created after sign-off. The audit log, under Settings › Audit log, shows the date of each change, who made it, and the original details (Intuit, "Use the audit log in QuickBooks Online," September 29, 2026).
- Business CentralThe Allow Posting From and Allow Posting To fields on the General Ledger Setup page set the posting window, and User Setup can override them for individual users (Microsoft Learn, "Specify posting periods," updated April 1, 2026). Record the date you move Allow Posting From past the closed month as your sign-off date.
- Excel or Google Sheets
NETWORKDAYS(start_date, end_date, holidays)counts both dates and skips weekends and listed holidays (Microsoft Support), so use period end + 1 as the start date. MEDIAN gives you the baseline.
In SAP S/4HANA, Oracle, or Xero, look for the same three timestamps under each system's own field names, and the formulas stay the same. Pull them into one sheet or BI tool each night of the close rather than keying results by hand.
Close management tools report days to close and reconciliation completion out of the box when they record due dates, completion dates, and sign-off themselves. When you compare tools, ask whether each timestamp comes from the system or from someone ticking a box. Also ask whether the tool does the reconciliation or only tracks it. The guide to the best month-end close software compares tools by the work they do.
Month-end close KPI scorecard template
A month-end close KPI scorecard is one table that shows each KPI's formula, owner, this month's result, 6-month median, target, and red, amber, or green status.
Download the free month-end close KPI scorecard (Excel)
Five tabs, with the example company's numbers filled in. Opens in Excel and Google Sheets.
The workbook has five tabs: the scorecard, a days-to-close calculator, a cost-per-close calculator, monthly inputs, and a read-me with every definition. The calculator counts business days against your holiday list, plus calendar days and APQC-style days. Blue text marks inputs, and the example company's numbers are filled in so you can see the format before you type over them. The file also opens in Google Sheets.
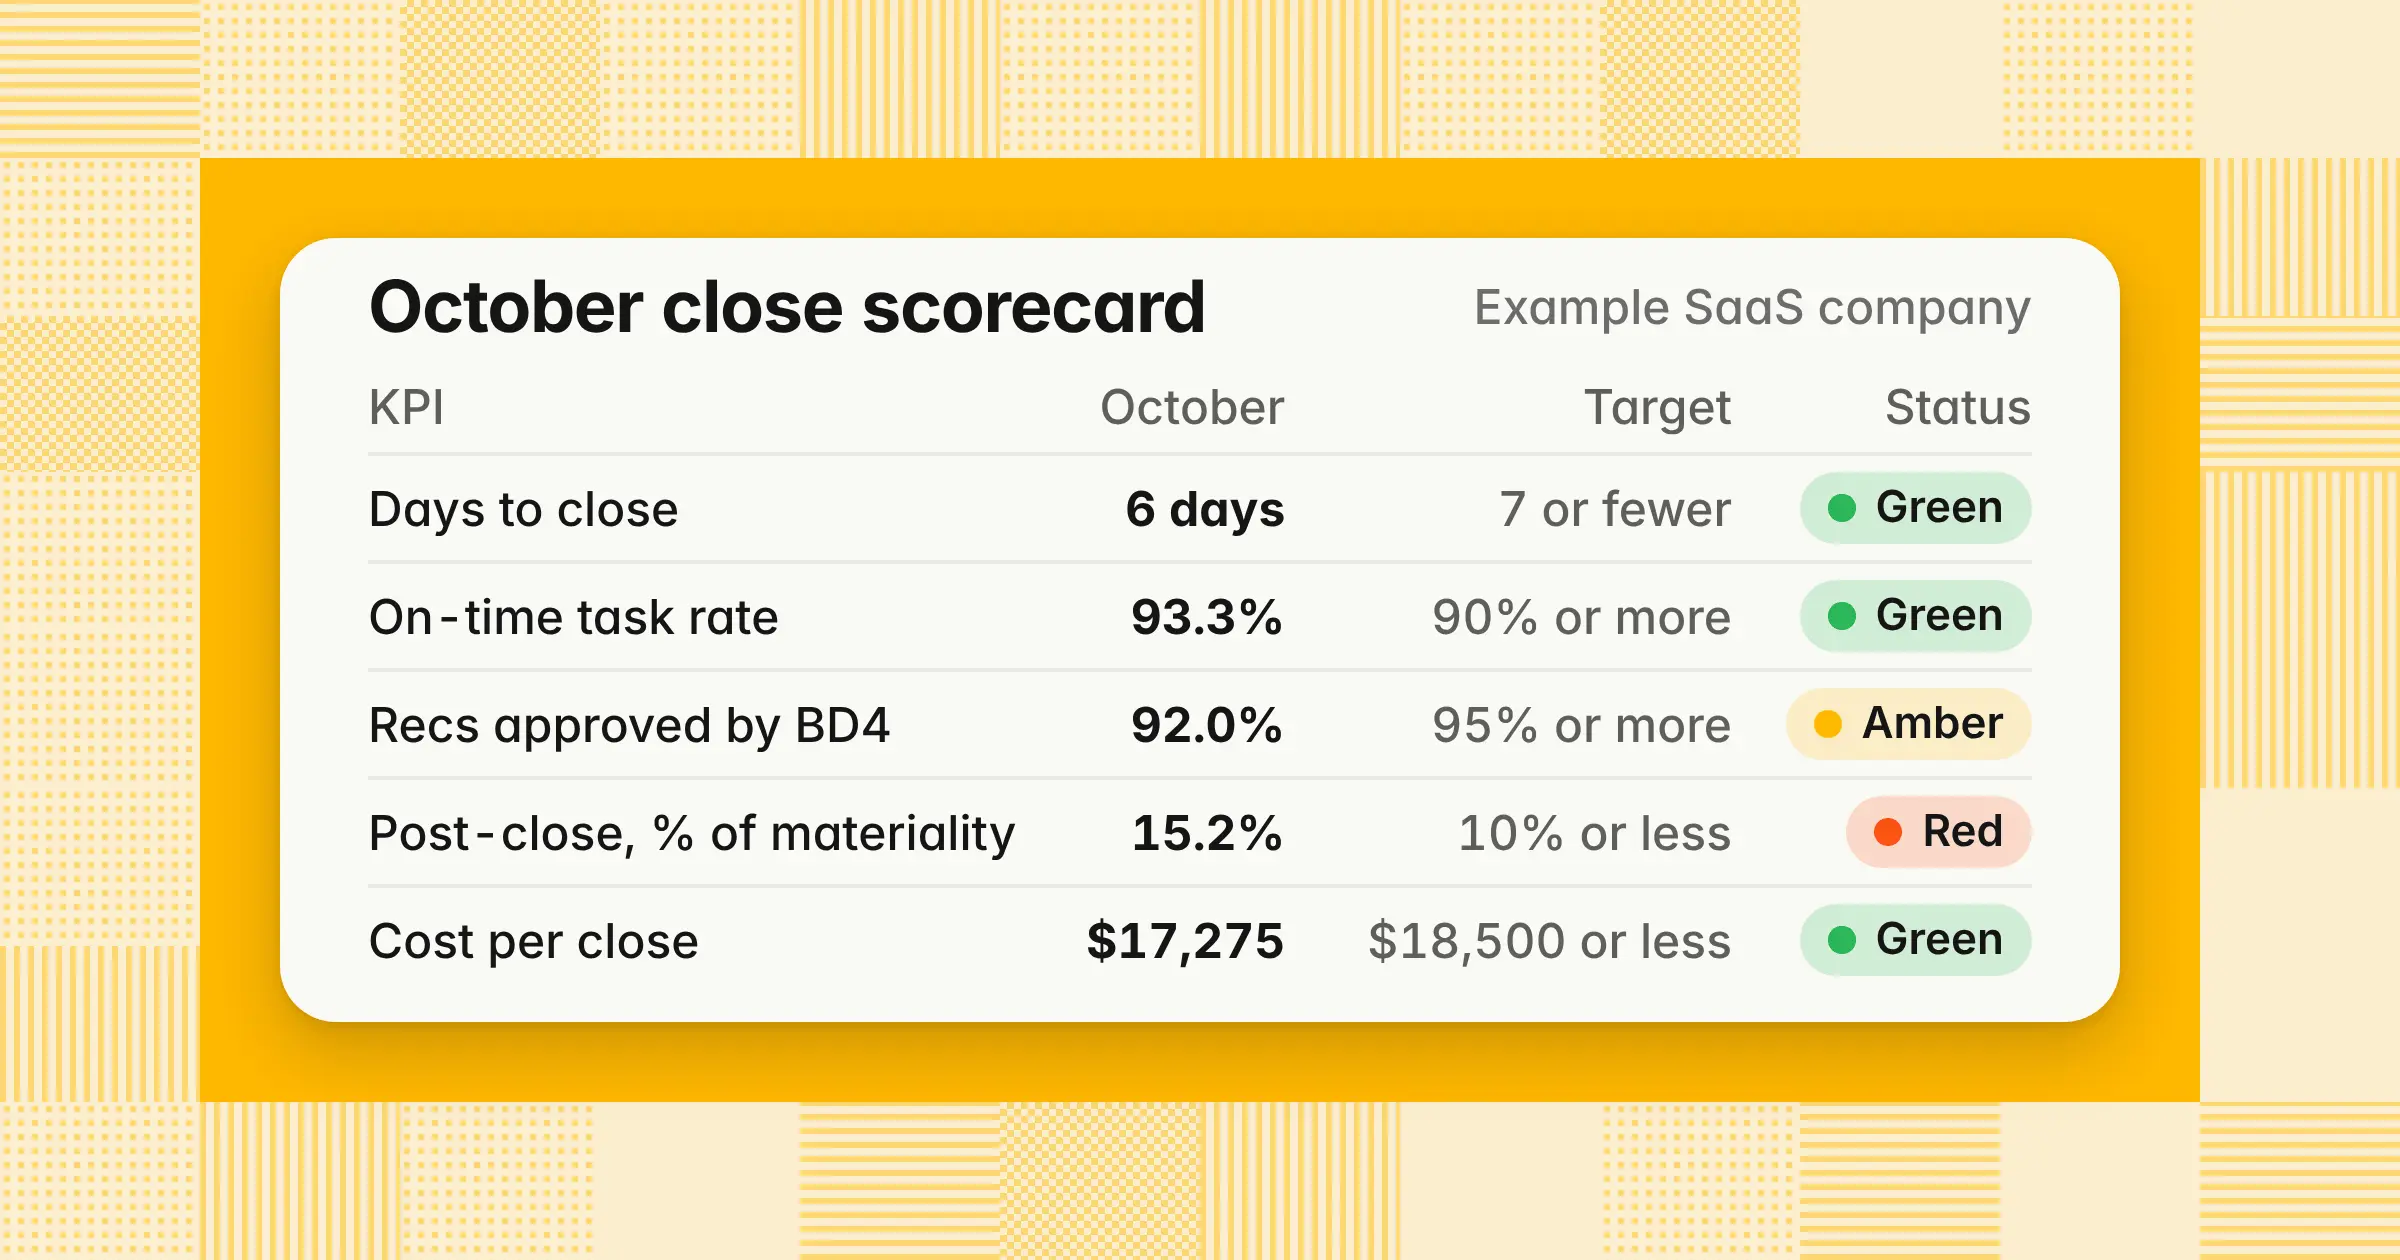
Here is the example company's October 2026 scorecard:
| KPI | October 2026 | 6-month median | Target | Status |
|---|---|---|---|---|
| Days to close | 6 | 8 | 7 or fewer | Green |
| On-time task rate | 93.3% | 86.9% | 90% or more | Green |
| Reconciliation completion by BD4 | 92.0% | 89.0% | 95% or more | Amber |
| Aged reconciling items over 30 days | 7 | 8.5 | 5 or fewer | Amber |
| Late journal entry rate | 6.4% | 7.5% | 5% or less | Amber |
| Post-close adjustments, count | 4 | 3 | 2 or fewer | Red |
| Post-close adjustments, % of materiality | 15.2% | 9.7% | 10% or less | Red |
| Close hours | 260 | 295 | 280 or fewer | Green |
| Cost per close | $17,275 | $19,264 | $18,500 or less | Green |
Days to close
- October 2026
- 6
- 6-month median
- 8
- Target
- 7 or fewer
- Status
- Green
On-time task rate
- October 2026
- 93.3%
- 6-month median
- 86.9%
- Target
- 90% or more
- Status
- Green
Reconciliation completion by BD4
- October 2026
- 92.0%
- 6-month median
- 89.0%
- Target
- 95% or more
- Status
- Amber
Aged reconciling items over 30 days
- October 2026
- 7
- 6-month median
- 8.5
- Target
- 5 or fewer
- Status
- Amber
Late journal entry rate
- October 2026
- 6.4%
- 6-month median
- 7.5%
- Target
- 5% or less
- Status
- Amber
Post-close adjustments, count
- October 2026
- 4
- 6-month median
- 3
- Target
- 2 or fewer
- Status
- Red
Post-close adjustments, % of materiality
- October 2026
- 15.2%
- 6-month median
- 9.7%
- Target
- 10% or less
- Status
- Red
Close hours
- October 2026
- 260
- 6-month median
- 295
- Target
- 280 or fewer
- Status
- Green
Cost per close
- October 2026
- $17,275
- 6-month median
- $19,264
- Target
- $18,500 or less
- Status
- Green
Status is green when this month meets the target. It's amber when it misses by no more than the KPI's amber band, a share of the target, such as 5% for reconciliation completion. Anything past the band is red. Read together, October was faster and cheaper than the baseline, but both post-close rows are red, which matches the BD3 reconciliation gap.
To feed the scorecard, add a due date and completion date to each task in your month-end close checklist. The free month-end close checklist generator builds one.
How we approach it
Our Close Agent prepares reconciliations, investigates exceptions, and proposes entries with support, then sends each one to a named reviewer. Your reconciliation and post-close KPIs move because the work itself moved. It reads from and posts approved entries to NetSuite, Oracle, SAP S/4HANA, Microsoft Dynamics 365, Business Central, and QuickBooks, and it reads from Odoo. It runs in a dedicated AWS account we manage for you, in your own AWS account, or on-premises. To see how it fits your scorecard, explore our Close Agent.
Share this article